We use cookies and similar technologies to recognise your repeat visits and preferences, as well as to measure the effectiveness of campaigns.
By clicking Allow, you agree to the use of cookies in accordance with our Privacy Policy.
Learn more.
BMBI Reports
-
April 07, 2025
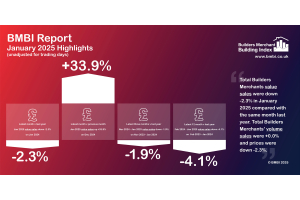
Builders Merchant’s value sales down -2.3% in January year-on-year, with prices -2.3% and flat volume sales
The latest Builders Merchant Building Index (BMBI) report, published in March, shows builders’ merchants’ value sales in January down -2.3% compared to the same month in 2024. Volume sales were flat (+0.0%) and prices slipped -2.3%. There was no difference in trading days.
-
March 05, 2025
Q4 Merchant value sales dip -0.5% as 2024 closes down -4.1% on last year
The latest Builders Merchant Building Index (BMBI) report reveals builders’ merchants’ value sales for Q4 2024 were down -0.5% compared to Q4 2023, as an increase in volume sales (+2.3%) was countered by a fall in prices (-2.7%). With one additional trading day in Q4 2024, like-for-like value sales (which take the number of trading days into account) were -2.2% lower.
-
January 31, 2025
Merchant’s November value sales fall -4.6%, as prices fall -3.4%
The latest Builders Merchant Building Index (BMBI) report, published in January, shows builders’ merchants’ value sales in November were down -4.6% compared to the same month in 2023. Volume sales slipped -1.3% and prices were also down -3.4%. With one less trading day this year, like-for-like value sales, which take trading day differences into account, were flat (-0.1%).
-
January 06, 2025
October Merchant sales rally with a +7.3% month-on-month increase
The latest Builders Merchant Building Index (BMBI) report, published in December, shows builders’ merchants’ value sales in October were up +1.2% compared to the same month last year. Volume sales climbed +2.7% while prices slipped -1.4%. With one additional trading day this year, like-for-like value sales (which take trading day differences into account) were down -3.2%.
Year-on-year, nine of the twelve categories sold more, and six did better than Total Merchants with Tools (+14.3%), Workwear & Safetywear (+10.1%), and Services (+6.0%) leading the field. The two largest categories, Heavy Building Materials (+1.1%) and Timber & Joinery Products (-1.0%), were both weaker than Total Merchants.
Month-on-month, October total value sales were +7.3% higher than September. Volume sales were up +6.5% and prices also edged up +0.7%. All bar one of the twelve categories sold more, with Renewables
-
December 10, 2024
Q3 Merchant value sales rose +1.7% quarter-on-quarter but were -2.6% adrift of last year’s sales
The latest Builders Merchant Building Index (BMBI) report reveals builders’ merchants’ value sales for Q3 2024 were down -2.6% compared to Q3 2023, with volume sales down -2.8% and prices virtually the same (+0.2%). With one additional trading day this year, like-for-like sales (which take the number of trading days into account) were -4.1% lower.
-
October 31, 2024
Merchants’ August sales fall -5.6% year-on-year in wash out summer
The latest Builders Merchant Building Index (BMBI) report, published in October, shows builders’ merchants’ value sales in August were down -5.6% compared to the same month in 2023. Volume sales dropped -5.7% with little movement in price (+0.2%). With one less trading day this year, like-for-like value sales were down -1.1%.
-
October 03, 2024
Builders’ Merchant July sales edge up+0.9% year-on-year
The latest Builders Merchant Building Index (BMBI) report, published in September, shows builders’ merchants’ value sales in July edged up +0.9% compared to the same month in 2023. There was a small increase in volume sales too (+0.6%) while prices remained flat (+0.3%). But with two more trading days this year, like-for-like value sales were down -7.9%.
Year-on-year, eight of the twelve categories performed better than Total Merchants, with Workwear & Safetywear (+27.7%), Tools (+9.8%) and Decorating (+8.8%) doing the best. The two largest categories – Heavy Building Materials (-0.2%) Timber & Joinery Products (-0.6%) – were virtually flat. Renewables & Water Saving (-28.4%) was the weakest category.
July total value sales were +11.6% higher than June, with volume sales increasing by +11.7% and little movement in price (-0.1%). Eight of the twelve categories outperformed Total Merchants
-
September 06, 2024
Q2 Merchant value sales down -5.8% on Q2 2023. June volumes weak.
The latest Builders Merchant Building Index (BMBI) report reveals builders’ merchants’ value sales for Q2 2024 were down -5.8% compared to Q2 2023, with volume sales down -7.2% and prices up +1.5%. With two extra trading days this year, like-for-like sales (which take the number of trading days into account) were -8.8% lower.
-
July 09, 2024
Merchants’ April sales up +3.9% but down -11.0% like-for-like
The latest Builders Merchant Building Index (BMBI) report, published in June, shows builders’ merchants’ value sales were up +3.9% in April compared to the same month a year ago. Volume sales increased +4.7% and prices eased -0.8%. However, with three additional trading days this year, like-for-like value sales were down -11.0%.
-
June 11, 2024
Builders’ Merchant Q1 value sales fell -7.2% year-on-year, as volumes slide -8.7%
The latest Builders Merchant Building Index (BMBI) report reveals builders’ merchants’ value sales in Q1 2024 were -7.2% down compared to Q1 2023, with volume sales falling -8.7% and prices edging up +1.6%. With one less trading day in Q1 2024, like-for-like sales (which take the number of trading days into account) were -5.7% lower.


